
Introduction
Modern Windows operative systems run hundreds of processes simultaneously, ranging from core operating system services to third-party applications and background tasks. While many of these processes are legitimate, others may indicate software malfunctions, security threats, or unauthorized activity. Continuous monitoring of live processes, combined with comprehensive logging, is therefore an essential component of system administration, cybersecurity, and incident response.
Psys
The idea behind psys.ps1 is to accomplish a unified system and network monitor written entirely in PowerShell, inspired by htop on Linux, built to run anywhere PowerShell 7 runs — including remote sessions and Windows Server Core where Task Manager simply isn’t available. What if you could have a top-style monitor that lives right inside your terminal, scriptable, loggable, and keyboard-driven?
Windows Task Manager is a great tool. But if you work in PowerShell terminals all day — managing servers, running scripts, monitoring deployments — switching to a GUI feels like a context break you didn’t need.
Getting the Script
The full script is available to direct download on https://github.com/az104tor/psys It requires PowerShell 7 and runs on Windows 10/11 and Windows Server 2019/2022. No external modules, no installation, only a ps1 file. Alternatively you can downloads a full local copy of my project git repository directly from PowerShell.
To install the PowerShell git modules launch it as administrator and run the commands:
Install-Module posh-git -Scope CurrentUser -Force
Install-Module posh-git -Scope CurrentUser -AllowPrerelease -Force # Newer beta version with PowerShell Core support
to clone on your local machine the psys project:
git clone https://github.com/az104tor/psys.gitPlease remember, that when a script is downloaded from the internet, user must unblock the file. Move to the Download directory and run:
cd psys
Unblock-File -Path .\psys.ps1
.\psys.ps1  # run the script
If you get an execution policy error:
Set-ExecutionPolicy -ExecutionPolicy RemoteSigned -Scope CurrentUserWhat psys.ps1 Does
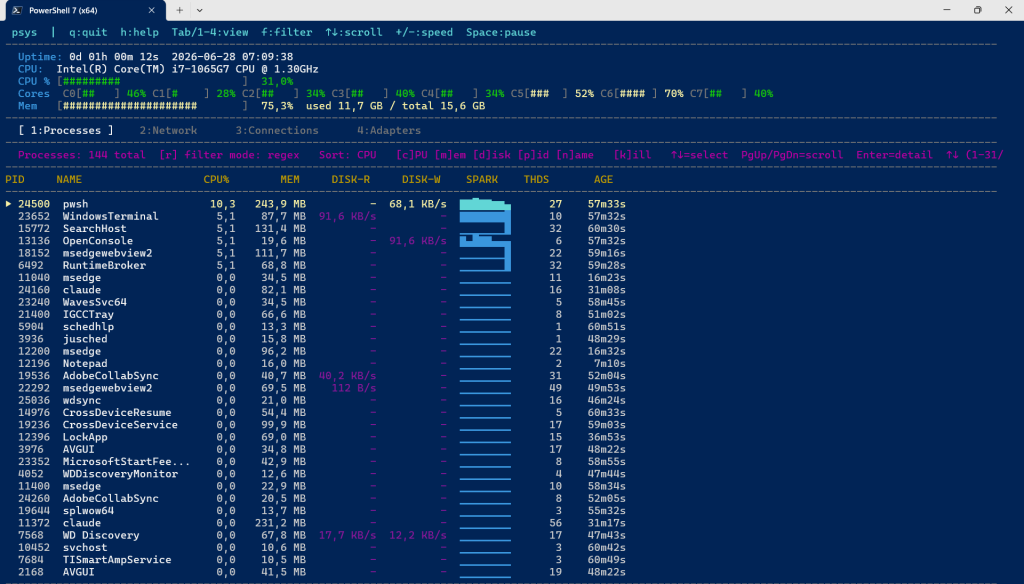
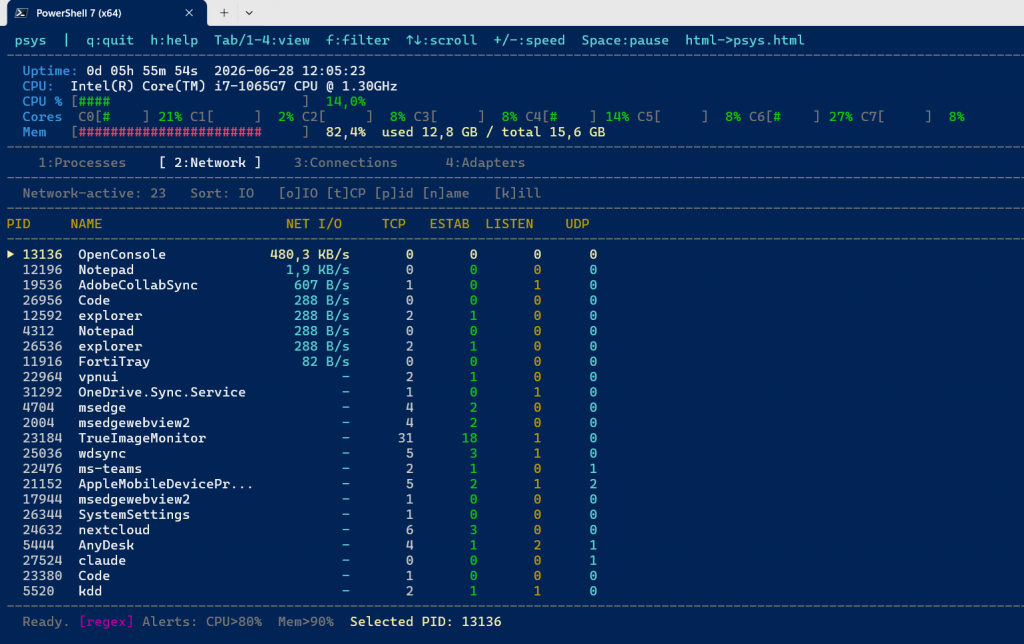
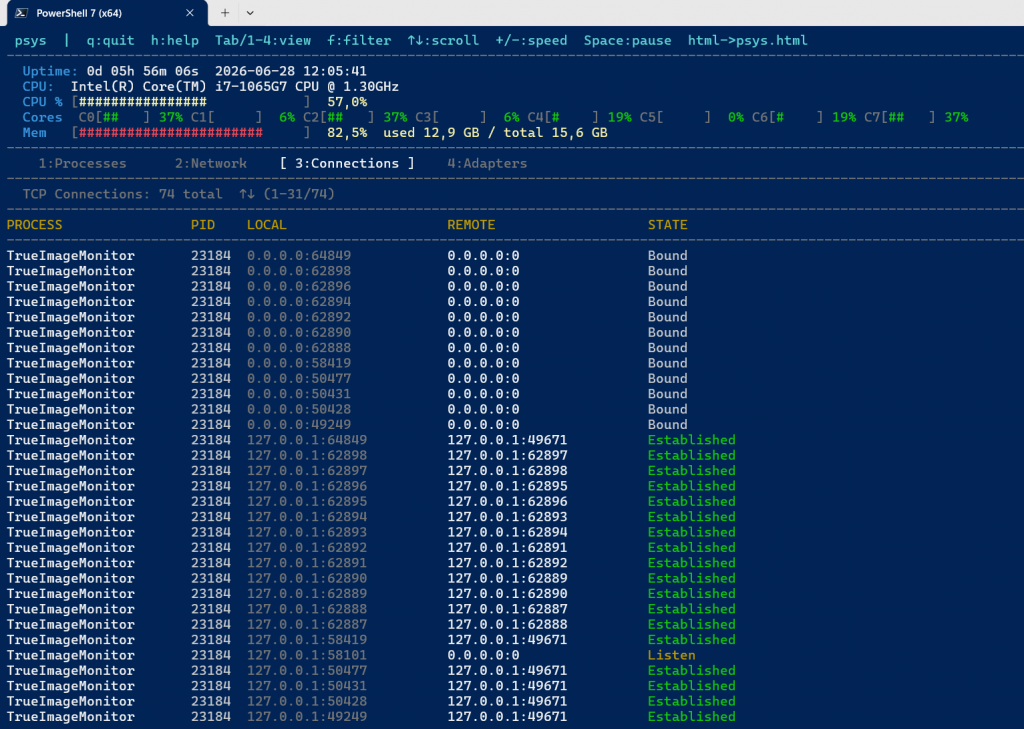
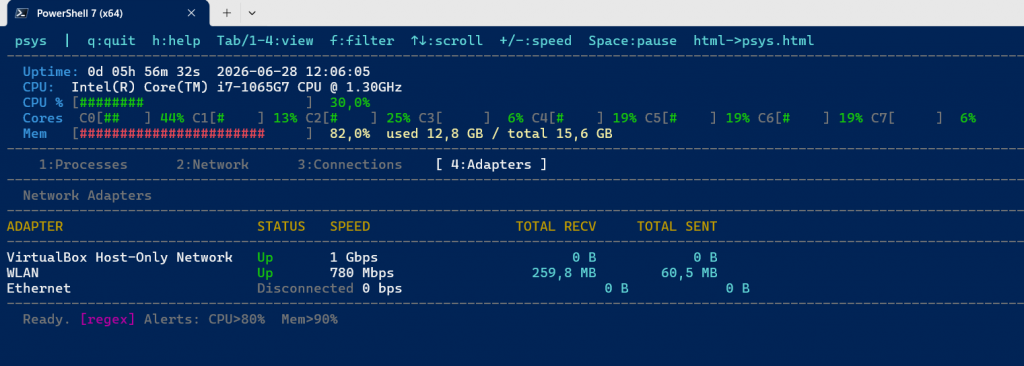
psys.ps1 gives you four live views inside a single terminal window, switchable instantly with the number keys or Tab:
| View | What it shows |
|---|---|
1 Processes | CPU%, memory, disk read/write, CPU sparkline, thread count, process age |
2 Network | Per-process network I/O, TCP connections, UDP endpoints |
3 Connections | Full TCP connection list with local/remote address, port, state |
4 Adapters | All network adapters, link status, speed, total bytes sent/received |
At the top of every view, a shared system header always shows:
- Uptime and current timestamp
- Overall CPU bar with percentage, colour-coded green / yellow / red
- Per-core CPU bars for all logical cores (C0–C7 on an 8-thread CPU, two rows on a 16-thread CPU)
- Memory bar showing used vs total, turning red when the alert threshold is exceeded
All data refreshes in a background thread on a configurable interval (default 5 seconds) while the main thread stays responsive to keypresses at all times — view switching is instant.
TAB / Processes /
TAB / Network/
TAB / Connections/
TAB / Adapters/
Usage
# Basic — uses defaults from param() block at top of script
.\psys.ps1

# Faster refresh
.\psys.ps1 -RefreshInterval 2

# With HTML session log
.\psys.ps1 -LogFile C:\logs\psys.html

# With HTML session log and CSV export
.\psys.ps1 -LogFile C:\logs\psys.html -CsvFile C:\logs\psys.csv

# Custom alert thresholds
.\psys.ps1 -AlertCPU 70 -AlertMem 85 -LogMaxSnapshots 500
Parameters
| Parameter | Default | Description |
|---|---|---|
-RefreshInterval | 5 | Seconds between data refreshes |
-LogFile | (none) | Path to HTML session log |
-CsvFile | (none) | Path to CSV export for Excel analysis |
-LogMaxSnapshots | 200 | Rolling snapshot window in the HTML log |
-AlertCPU | 80 | CPU% threshold for per-process alerts |
-AlertMem | 90 | Memory% threshold for system alerts |
All defaults are set directly in the param() block at the top of the script — edit them once and your preferences persist every time you run it, with no separate config file needed.
Keyboard Controls
| Key | Action |
|---|---|
Tab / 1–4 | Switch view instantly |
h | Toggle help screen |
↑ / ↓ | Move selection cursor (scrolls list at edges) |
PgUp / PgDn | Scroll list by one full page |
Enter | Open process detail popup for selected row |
Esc | Close detail / help popup, or quit |
c m d | Sort by CPU / Memory / Disk (view 1) |
o t | Sort by Net I/O / TCP count (view 2) |
p n | Sort by PID / Name (views 1 & 2) |
f | Filter by process name |
r | Toggle filter mode: regex / wildcard |
k | Kill a process by PID (or kill from detail popup) |
+ / - | Increase / decrease refresh interval |
Space | Pause / resume |
q | Quit |
Smart Filter with Regex Support
Pressing f opens a clearly visible filter input at the bottom of the screen:
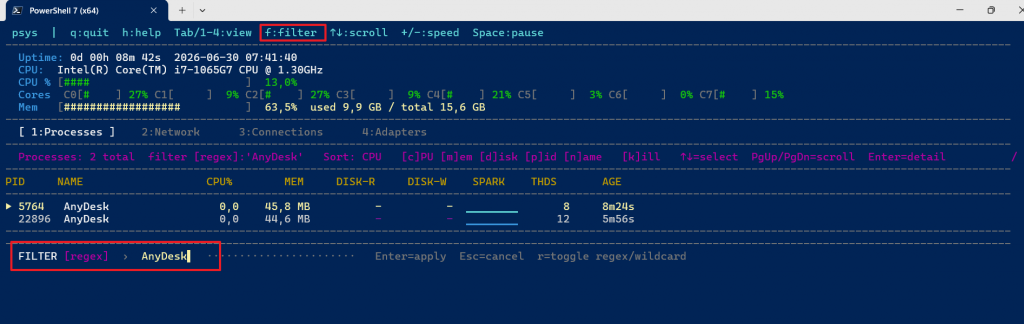
FILTER [regex] › AnyDesk▌····················· Enter=apply Esc=cancel r=toggle regex/wildcard
“`
The typed text appears in yellow with a block cursor so you always know where you’re typing. Press r to toggle between two filter modes:
Wildcard mode — simple substring matching:
edge        → matches msedge, msedgewebview2
svc         → matches all svchost instances
Regex mode (default) — full regular expressions:
^ms         → processes starting with "ms"
edge|chrome → msedge OR chrome in one filter
svc\d*      → svchost with optional numbers
(?i)EDGE    → case-insensitive match
The current mode is always shown in the status bar at the bottom. If you type an invalid regex it silently falls back to wildcard rather than crashing.
Selection Cursor and Process Detail Popup
The ▶ row cursor required tracking two separate concepts that are easy to confuse: the scroll offset (which row in the full list is at the top of the visible area) and the selection index (which row within the visible area is highlighted). The two are independent — you can have the 50th process scrolled to the top with the cursor on the 3rd visible row, meaning the selected process is the 52nd overall.
When ↑ is pressed and the selection is already at the top of the visible area, the scroll offset decreases instead, pulling a new row into view. This gives the feel of a single continuous cursor moving through the list, even though it is implemented as two separate variables.
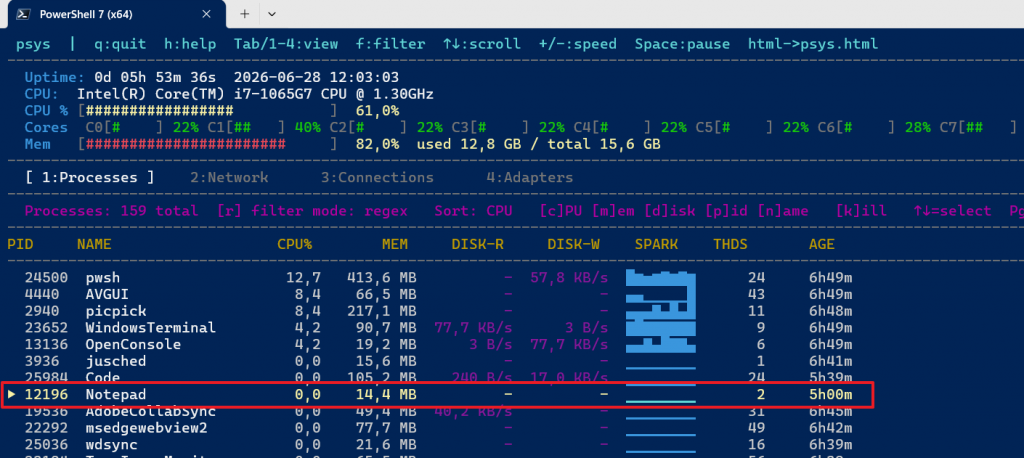
Pressing Enter on any highlighted row opens a full-screen detail panel for that process:
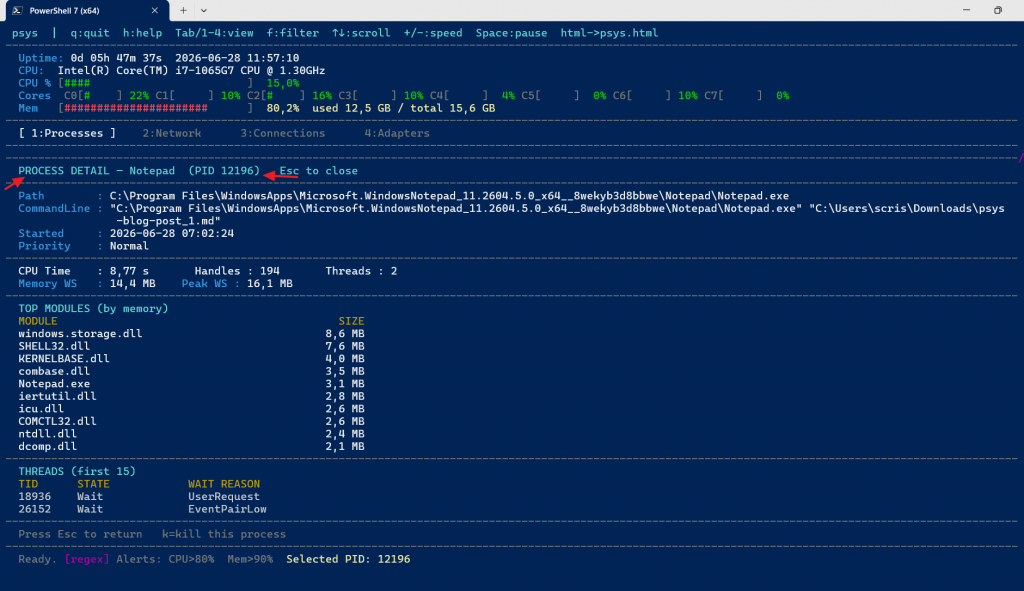
Press Esc to return k=kill this process
You can also press k while inside the detail panel to kill that process directly. Use ↑/↓ to move the ▶ selection cursor to a different process before pressing Enter.
HTML Session Log
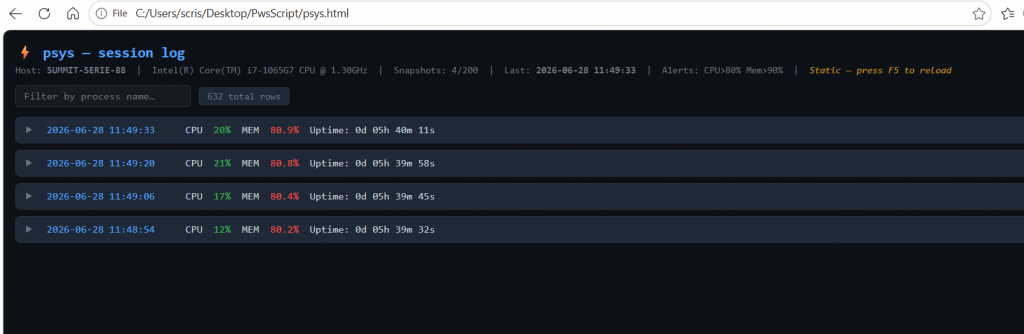
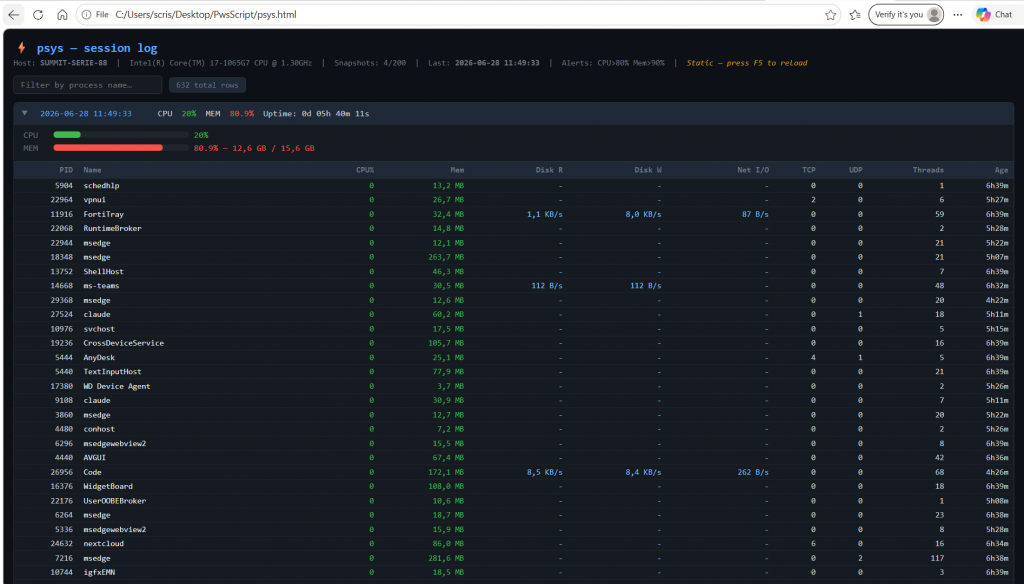
When -LogFile is specified, every refresh cycle is saved as a collapsible snapshot in a dark-themed static HTML file. Open it in any browser, use the live search box to filter by process name, and review history at your own pace. Alerts are collected in a dedicated section at the top with timestamps. The file never auto-refreshes — press F5 when you want to load the latest data.
HTML Logs snapshoots:
Expand a single Snapshoot:
CSV Export for Excel Analysis
Alongside the HTML log, psys.ps1 can write a CSV file with one row per process per refresh cycle:
Timestamp,PID,Name,CPU_Pct,Mem_Bytes,Mem_MB,DiskRead_Bps,DiskWrite_Bps,NetOther_Bps,TCP_Connections,UDP_Endpoints,Threads,Age,Alert
2026-06-20 23:55:18,5352,"msedge",20.0,280608768,267.5,639300,620800,0,4,0,29,0m03s,0
2026-06-20 23:55:18,3728,"picpick",1.1,123731968,118.0,0,0,0,0,0,13,14m27s,0
The Alert column is 1 when a process exceeded the CPU threshold at that snapshot — making it trivial to filter in Excel with =FILTER(A:N, N:N=1) to review only the problematic moments.
psys.ps1 vs Windows Task Manager
Task Manager and psys.ps1 are after the same data but make very different trade-offs.
Task Manager is a polished GUI with features a terminal tool cannot match:
- Suspend a process (not just kill it)
- Open file location or search online for unknown processes
- App history with cumulative CPU and network usage across sessions
- Startup impact scoring — which programs slow down your boot
- Performance graphs with historical charts for CPU, memory, disk, and network
- Users tab showing which session owns which process
What psys.ps1 Does Better:
It lives in your terminal. On a Windows Server Core installation, headless VM, or SSH session, Task Manager is not available at all. psys.ps1 runs anywhere PowerShell 7 runs.
View switching is instant. Because data collection runs in a background thread, pressing 1, 2, 3, or 4 re-renders the screen in under 80ms regardless of where the collection cycle is.
It has a selection cursor. ↑/↓ moves a ▶ highlight through the process list. Pressing Enter opens a full detail panel for the selected process — executable path, full command line, TCP connections, loaded modules, thread list. Task Manager shows some of this in Properties, but requires right-clicking and navigating dialogs.
It has a CPU history sparkline per process. Each process row shows a miniature bar chart (▁▂▄█▆▃) of its last 10 CPU readings. You can see at a glance whether a process is spiking, settling, or steady — something Task Manager only shows at the system level, not per-process.
It detects new processes. Any process that appeared since the last refresh is highlighted in green for one cycle, making it easy to spot unexpected launches.
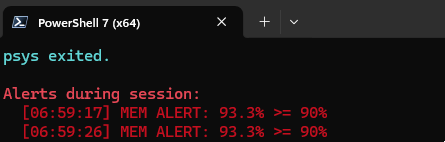
It has configurable alert thresholds. Launch with -AlertCPU 70 -AlertMem 85 and psys.ps1 highlights exceeding processes in red, shows a badge in the header, and writes timestamped alerts to both the HTML and CSV logs. Task Manager has no persistent alerting.
It exports to CSV for Excel. The CSV log with an Alert column lets you pivot, chart, and filter the entire session in Excel. Task Manager has no export at all.
It uses the same data sources as Task Manager. psys.ps1 reads from Win32_PerfFormattedData_PerfProc_Process and Win32_PerfFormattedData_PerfOS_Processor — the same locale-independent WMI classes the Windows performance subsystem exposes to Task Manager.
It is a single plain-text file. Every colour, threshold, column width, and data source is readable and modifiable PowerShell. No binaries, no installation, no dependencies.
Conclusion
Monitoring live processes on Windows OS is a fundamental practice for maintaining system health, improving performance, and strengthening cybersecurity. While real-time monitoring provides immediate visibility into system activity, historical log reports enable administrators and security analysts to perform forensic investigations, identify trends, detect anomalies, and respond effectively to incidents.
By combining continuous process monitoring with automated logging and structured reporting, you can move from reactive troubleshooting to proactive system management, reducing downtime, improving security posture, and maintaining a reliable record of system activity over time.
About the Author